Research Topics
When to use Relative Risk vs. Odds Ratio vs. Hazard Ratio in Clinical Research
Relative Risk (RR), Odds Ratio (OR), and Hazard Ratio (HR) are key statistical measures in clinical research used to assess the association between exposures and outcomes. Learn what they are and when to use them.
Introduction
In clinical research, understanding different measures of association—Relative Risk (RR), Odds Ratio (OR), and Hazard Ratio (HR)—is essential for evaluating risk factors, measuring intervention effectiveness, and guiding healthcare decisions.
Although these measures are related, they serve different purposes and are often misinterpreted. This blog post will clarify the distinctions between RR, OR, and HR, explaining when and how each should be used in research and clinical practice.
What is Relative Risk (RR)?
Relative Risk (RR) is a fundamental measure in epidemiology and clinical research that quantifies how much more (or less) likely an event is to occur in an exposed group compared to an unexposed group4. It is calculated using the formula:

The interpretation of RR depends on its value:
- RR = 1 suggests no difference in risk between the exposed and unexposed groups.
- RR > 1 indicates an increased risk in the exposed group, meaning the exposure is associated with a higher likelihood of the event occurring.
- RR < 1 implies a decreased risk, suggesting the exposure may have a protective effect.
For example, consider a study examining the relationship between smoking and heart disease. If the risk of developing heart disease in smokers is 30% (0.30) and in non-smokers is 12% (0.12), the RR would be:

This means that smokers are 2.5 times more likely to develop heart disease compared to non-smokers. Because RR provides a direct comparison of probabilities, it is particularly useful in cohort studies and clinical trials, where researchers track groups over time to observe the effects of specific exposures or interventions.
How Does Relative Risk (RR) Differ from Odds Ratio (OR)?
While both RR and OR measure the association between an exposure and an outcome, they differ in calculation, interpretation, and application. Probability refers to the likelihood of an event occurring out of all possible events, while odds represent the ratio of the probability of the event occurring to the probability of it not occurring. This distinction is important because RR is based on probability, whereas OR is based on odds, and odds tend to exaggerate risk when the outcome is common.
The calculations for RR and OR are based on a 2x2 contingency table:
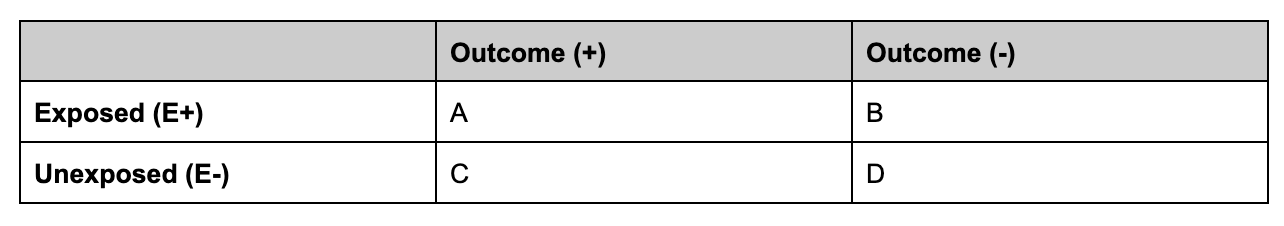
Relative Risk (RR) is calculated as:

This represents the probability of the outcome occurring in the exposed group relative to the unexposed group.
- Odds Ratio (OR) is calculated as:

- This represents the odds of the outcome occurring in the exposed group compared to the unexposed group.
Although both RR and OR values greater than 1 indicate an increased likelihood of an outcome, and values less than 1 suggest a protective effect, they are not interchangeable. RR provides a direct measure of risk and is easier to interpret, while OR can overestimate risk, particularly when the outcome is common. This difference is evident in scenarios where the event of interest occurs frequently. For example, if a study finds that 40% of smokers develop lung disease compared to 20% of non-smokers, the RR = 2.0, meaning smokers are twice as likely to develop lung disease. However, the OR in this case would be 2.67, an overestimation of the actual risk increase.
In terms of study design, RR is commonly used in cohort studies and randomized controlled trials (RCTs), while OR is used in case-control studies due to its ability to estimate associations when true risk cannot be directly measured. Additionally, OR has mathematical advantages in multivariate analyses, making it useful for adjusting for confounding factors. Importantly, when the event is rare (typically <10%), OR closely approximates RR, making it a reasonable alternative.
How Does RR Differ from Hazard Ratio (HR)?
While Relative Risk (RR) and Hazard Ratio (HR) both compare risks between groups, they differ in how they account for time. RR provides a cumulative measure of risk at the end of a study, comparing the overall likelihood of an event occurring in an exposed group versus an unexposed group. In contrast, HR is used in time-to-event (survival) analysis and measures how quickly an event happens in one group compared to another over time9. Derived from Cox proportional hazards models, HR accounts for both the number of events and their timing, making it particularly useful in studies with follow-up periods, such as cancer survival rates or cardiovascular event monitoring10.
For example, in a clinical trial evaluating a new heart disease medication, RR might indicate that patients on the drug have a 20% lower overall risk of heart attacks by the study’s end, while HR could show that the treatment group experiences significantly fewer heart attacks at any given point in time. Unlike RR, which assumes constant risk, HR captures variations in risk over time, making it a more dynamic measure for analyzing long-term outcomes11. The choice between RR and HR depends on the study design and whether the timing of events is crucial to interpretation.
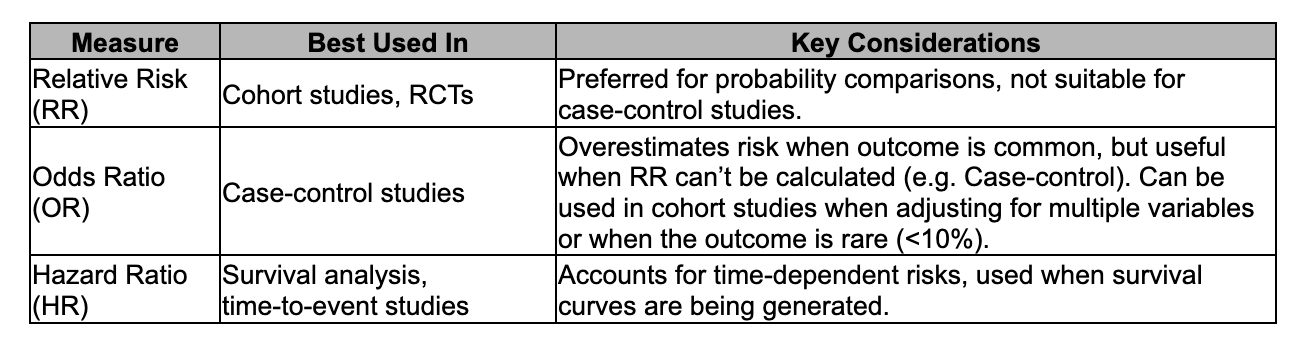
When to Use RR, OR, and HR?
The choice between RR, OR, and HR depends on the study design and the nature of the outcome being analyzed. RR is most appropriate in cohort studies and randomized controlled trials (RCTs), where researchers can directly measure the probability of an event occurring over a defined period. OR is commonly used in case-control studies, where researchers cannot measure true risk but can compare the odds of exposure between cases and controls. OR is also useful in logistic regression models when adjusting for confounding variables. HR is the preferred measure in time-to-event (survival) analysis, particularly in studies where event timing matters, such as cancer survival rates or cardiovascular disease progression. When events occur over time and risk is not constant, HR provides a more dynamic and precise measure than RR. Ultimately, selecting the correct statistical measure ensures accurate interpretation of results and meaningful comparisons between study groups.
References
1. Murray, C. J., Ezzati, M., Lopez, A. D., Rodgers, A. & Vander Hoorn, S. Comparative quantification of health risks: Conceptual framework and methodological issues. Popul. Health Metr. 1, 1 (2003).
2. Canada, H. Health Canada Decision-Making Framework for Identifying, Assessing, and Managing Health Risks - August 1, 2000. https://www.canada.ca/en/health-canada/corporate/about-health-canada/reports-publications/health-products-food-branch/health-canada-decision-making-framework-identifying-assessing-managing-health-risks.html (2000).
3. Jewell, N. P. Risk Comparisons. Am. J. Ophthalmol. 148, 484–486 (2009).
4. Principles of Epidemiology | Lesson 3 - Section 5. https://archive.cdc.gov/www_cdc_gov/csels/dsepd/ss1978/lesson3/section5.html (2023).
5. Tenny, S. & Hoffman, M. R. Relative Risk. in StatPearls (StatPearls Publishing, Treasure Island (FL), 2025).
6. Understanding The Odds: Statistics in Public Health. Frontiers for Young Minds https://kids.frontiersin.org/articles/10.3389/frym.2022.926624.
7. Understanding Relative Risk, Odds Ratio, and Related Terms: As Simple as It Can Get. Psychiatrist.com https://www.psychiatrist.com/jcp/understanding-relative-risk-odds-ratio-related-terms/.
8. Szumilas, M. Explaining Odds Ratios. J. Can. Acad. Child Adolesc. Psychiatry 19, 227–229 (2010).
9. Bates, S. L. Research Guides: Statistics - explanations and formulas: Hazard Ratio. https://libguides.und.edu/c.php?g=1333878&p=10080502.
10. Sashegyi, A. & Ferry, D. On the Interpretation of the Hazard Ratio and Communication of Survival Benefit. The Oncologist 22, 484–486 (2017).
11. George, A., Stead, T. S. & Ganti, L. What’s the Risk: Differentiating Risk Ratios, Odds Ratios, and Hazard Ratios? Cureus 12, e10047.

