Research Topics
Funnel Plots in Systematic Reviews with Meta-Analyses: A Concise Overview
Funnel Plots can be useful to assess for publication bias during systematic reviews with meta-analyses. Let's explore how (and how not) to use them.
Introduction to Funnel Plots
Funnel plots are a graphical tool used in systematic reviews and meta-analyses (SRMAs) to assess publication bias and small-study effects. These plots help researchers detect whether certain studies are missing from the meta-analysis due to selective publication.
A funnel plot graphs study effect size on the horizontal axis and study precision (often the standard error) on the vertical axis. In an unbiased meta-analysis, smaller studies will be more spread out, while larger studies will cluster near the pooled effect size, creating a symmetrical inverted funnel shape. Asymmetry in the plot—such as missing smaller studies on one side—suggests possible publication bias or other systematic differences between smaller and larger studies.
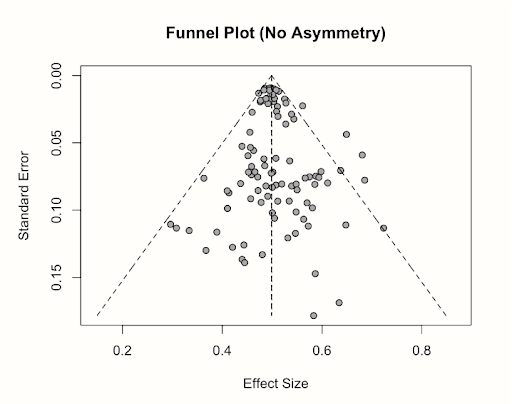
Normal Funnel Plot (No publication bias)
How to Interpret a Funnel Plot
Interpreting a funnel plot involves examining the symmetry and spread of the plotted studies:
- Identify the shape: A symmetrical inverted funnel suggests no major publication bias, while asymmetry indicates missing studies or small-study effects.
- Check for missing studies: If one side of the plot is sparsely populated, it may indicate that studies with certain results are unpublished or difficult to find.
- Consider study distribution: Larger studies (at the top) should be tightly clustered, while smaller studies (at the bottom) should be more scattered. If smaller studies show exaggerated effects, this could indicate small-study effects.
- Look for outliers: A single large outlier can skew the funnel plot, making it appear asymmetric when it may not be due to bias.
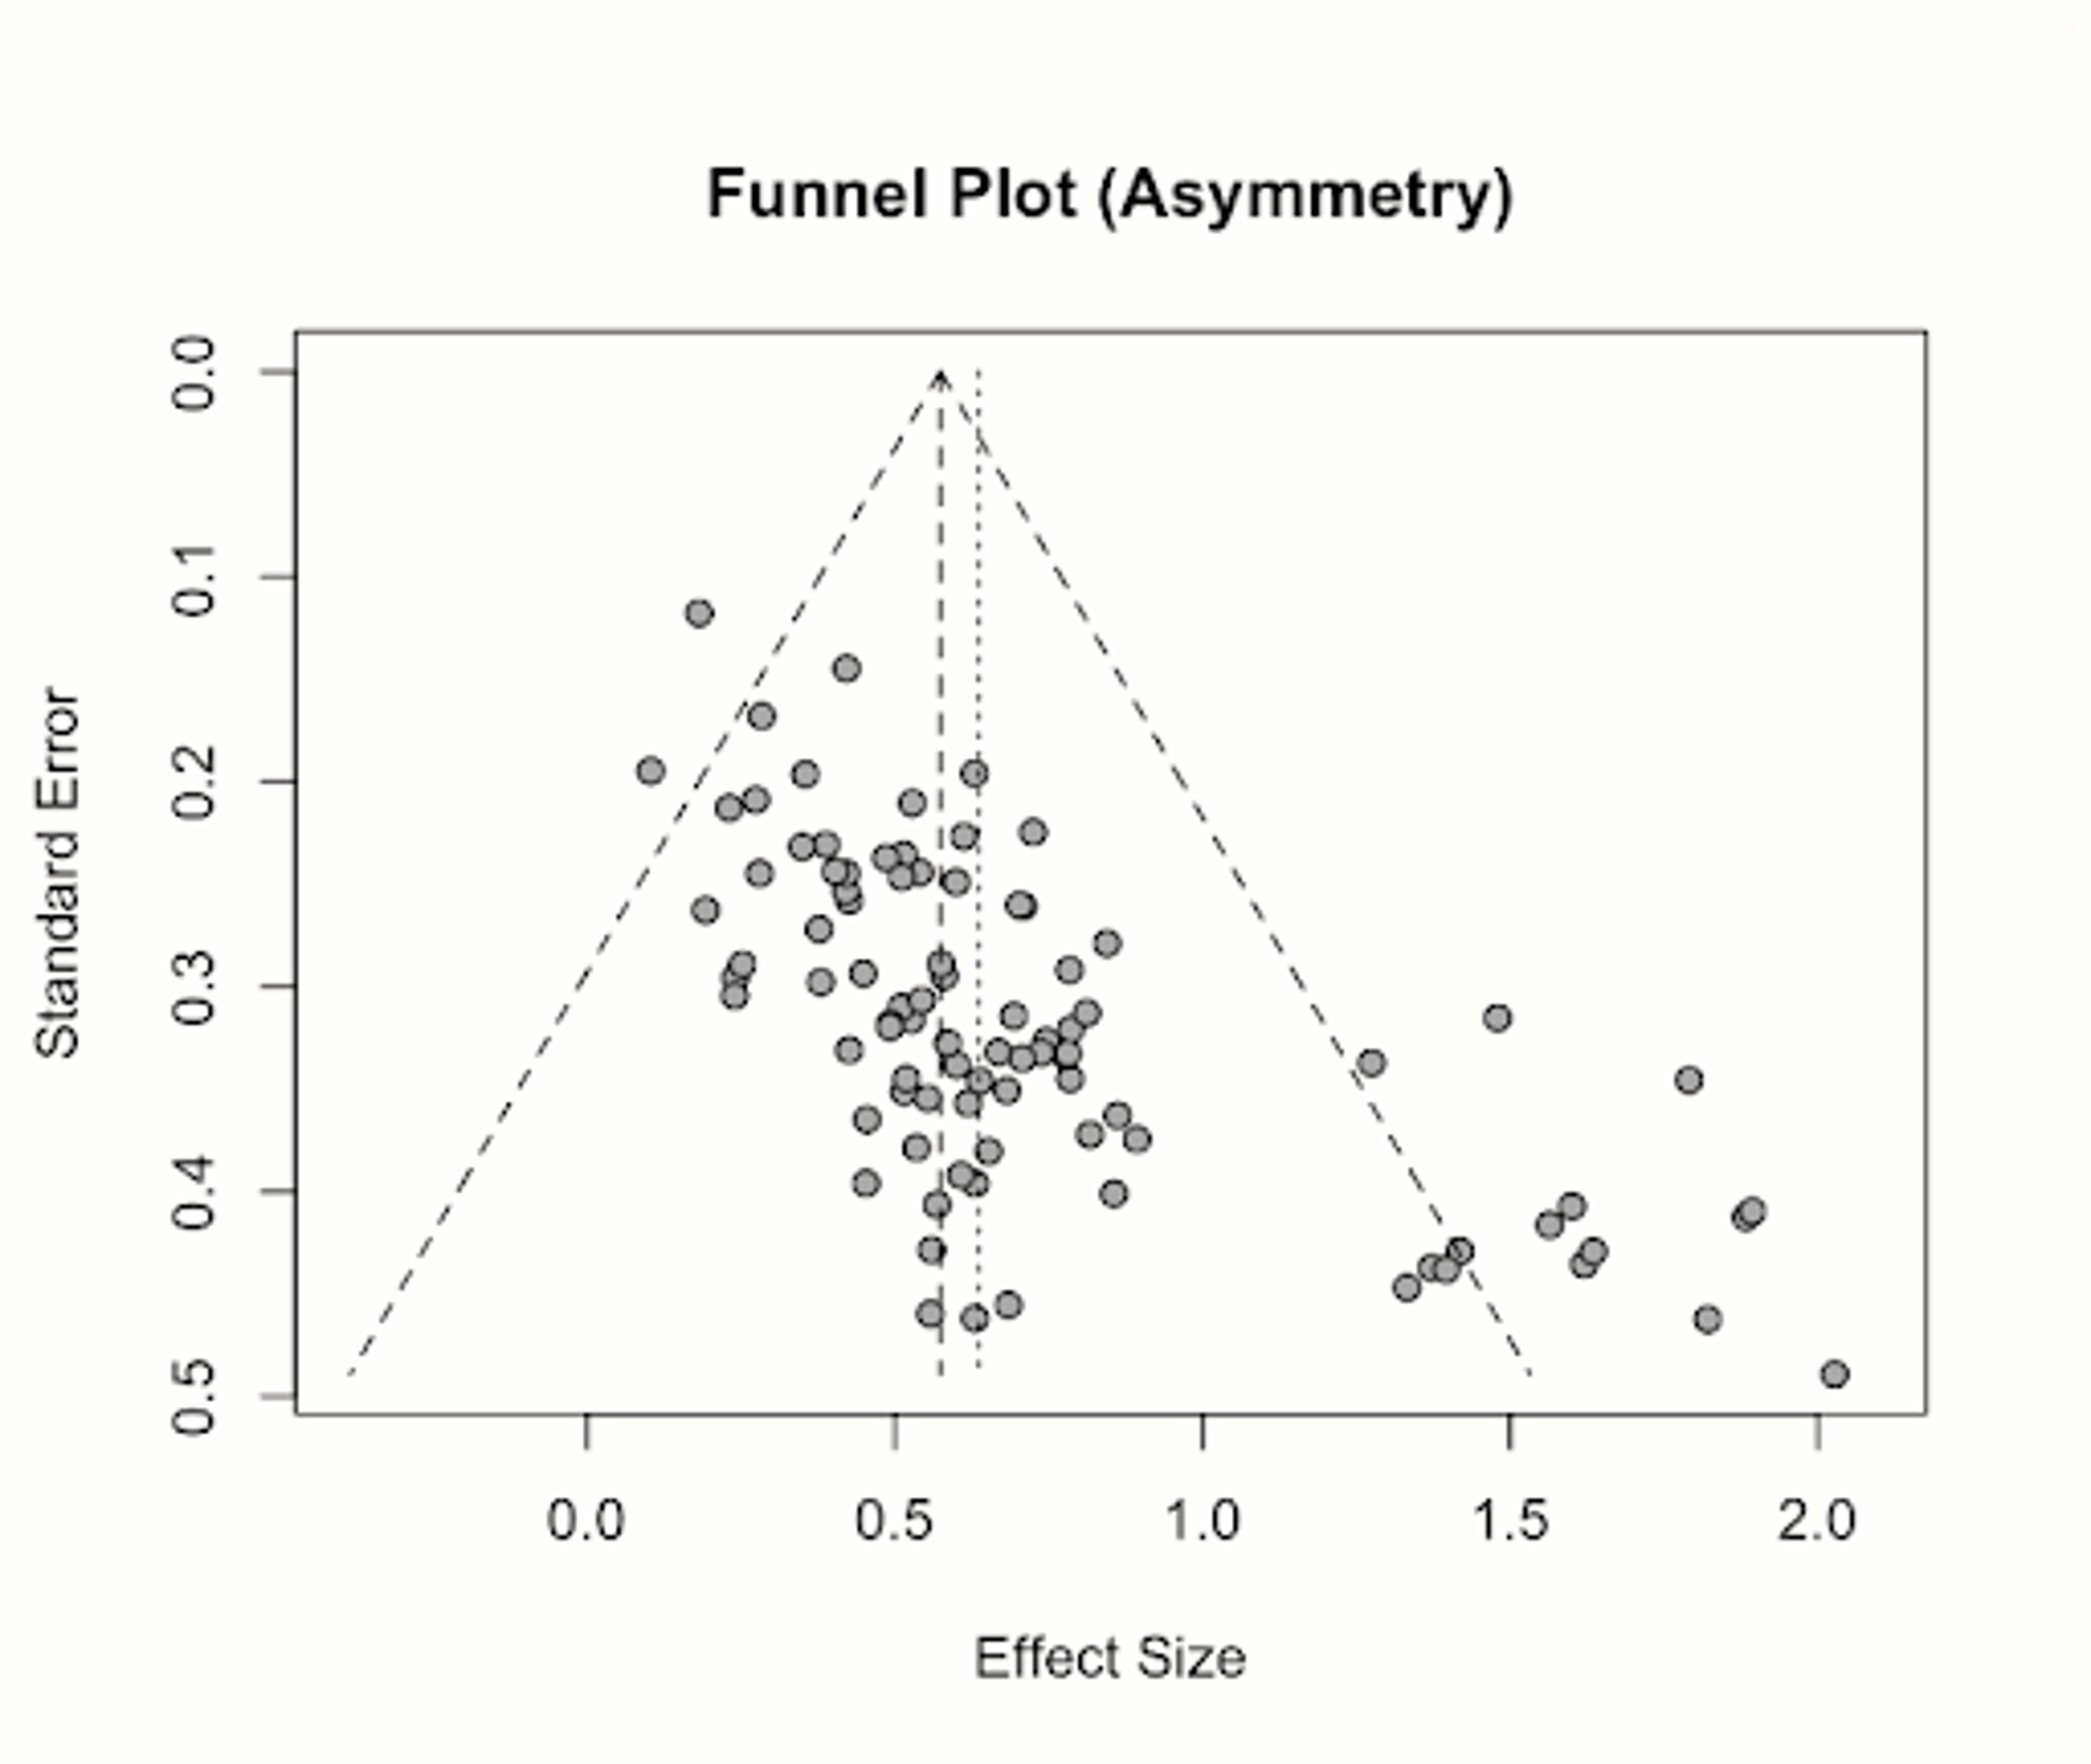
Funnel Plot with Publication Bias (small studies missing from bottom left)
When NOT to Use Funnel Plots
While funnel plots are widely used, they have significant limitations and should be interpreted cautiously:
- Too few studies: Funnel plots are unreliable when fewer than 10 studies are included, as any asymmetry may be due to chance.
- High heterogeneity: If studies in the meta-analysis vary widely in methods, populations, or interventions, funnel plots may be misleading.
- False positives: Not all asymmetry is due to publication bias—clinical differences, methodological variations, or chance can also distort the plot.
- Outcome reporting bias: Funnel plots assess missing studies but do not account for selective outcome reporting within studies, which can also bias results.
Alternative Methods to Assess Publication Bias
To complement funnel plots, researchers often use statistical tests:
- Egger’s Regression Test: A formal test that quantifies funnel plot asymmetry. A significant result suggests potential publication bias, but it is less reliable with small numbers of studies (don't use if <10 studies).
- Trim-and-Fill Method: Estimates missing studies based on asymmetry and adjusts the pooled effect size accordingly, but assumes a specific type of missingness.
- Begg’s Test: A rank correlation test that detects funnel plot asymmetry but has lower power than Egger’s test.
These methods can be used alongside visual funnel plot inspection to provide a more robust assessment of bias.
Conclusion
Funnel plots are a valuable tool in systematic reviews and meta-analyses but should be interpreted with caution. While asymmetry can indicate publication bias, it is not definitive proof, and researchers should consider alternative explanations and complementary statistical tests. A well-conducted meta-analysis incorporates multiple approaches to assess bias and ensures the most accurate representation of available evidence.

